ENERGY MONITORING SYSTEM(EMS)
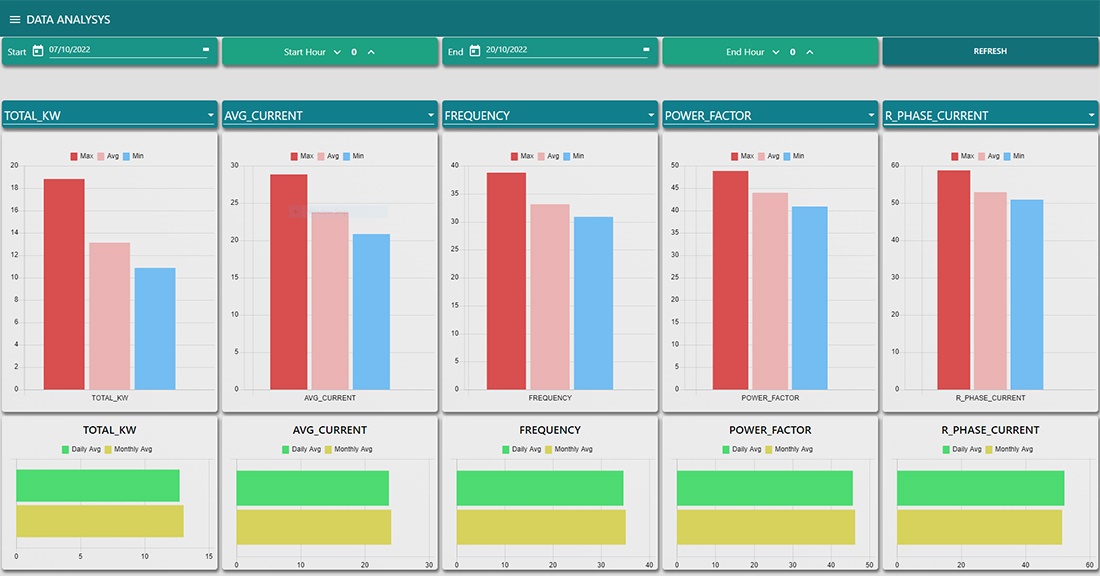
- Easy To Monitor Key Energy Parameters and Overview of The Plant Consumption Through Smart EMS DASHBOARD
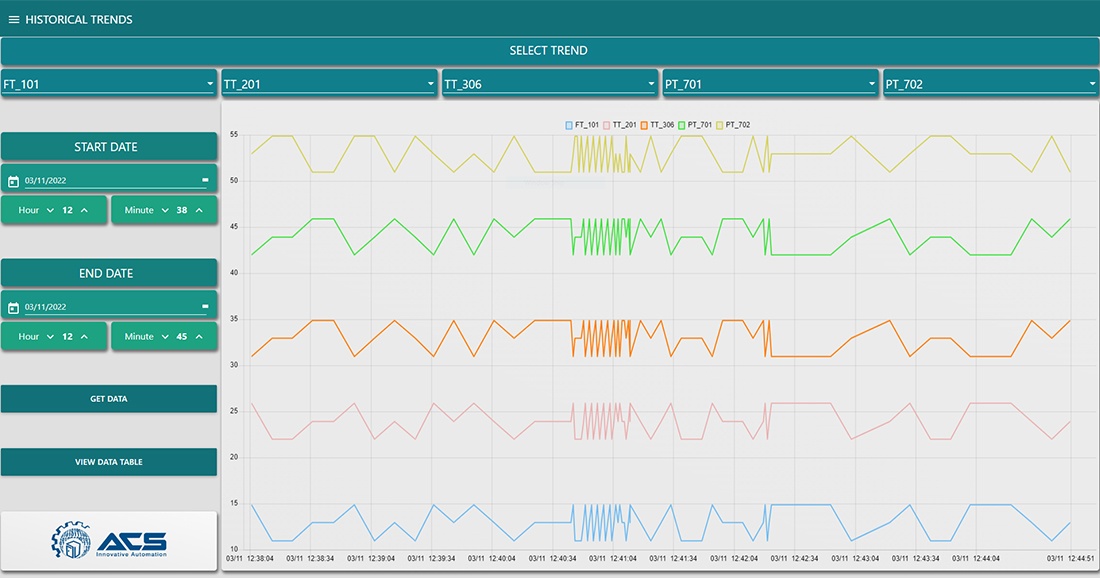
- Live Trends Makes Easy to Understand the Current Scenario.
- Daily and Monthly Power Consumption and Cost Data.
- Cost Prediction of the Power Consumption.
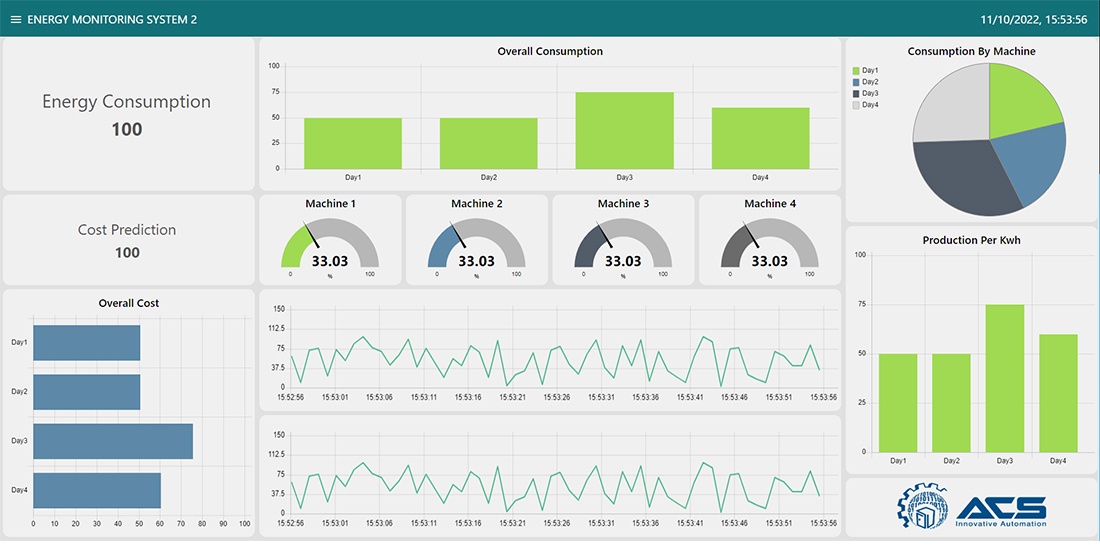
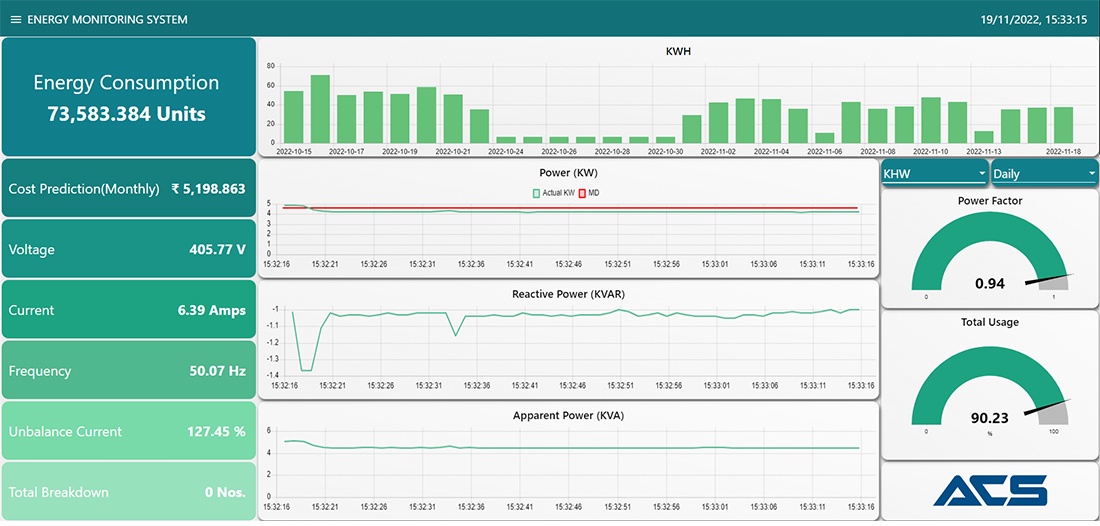
- Different Types of Smart and Eye capturing themes for EMS DASHBOARD.
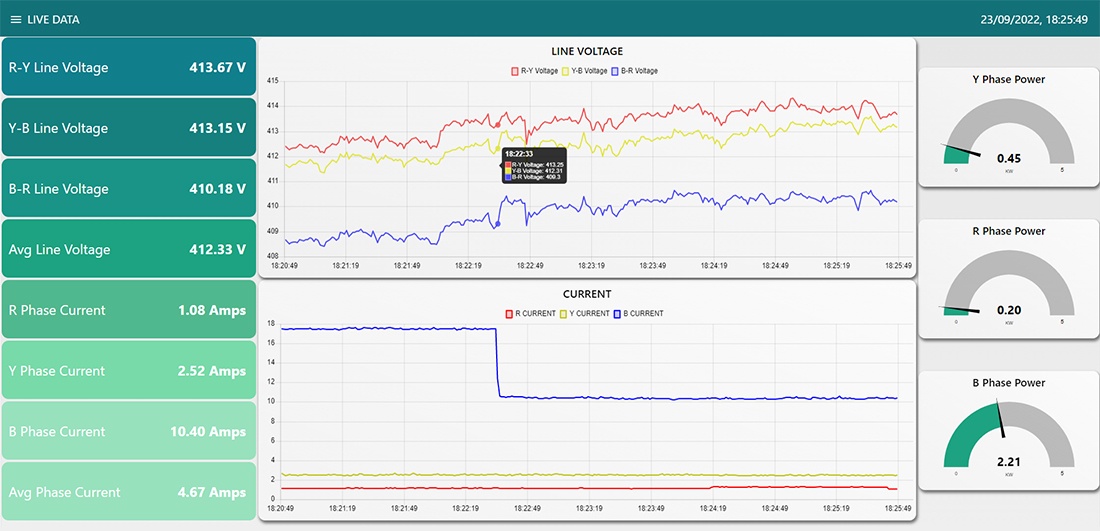
- Live Data Screen for more analysis of the Energy Consumption of the Plant.
- You Can Monitor Machine or Equipment Wise Live Data, So at One Place You can See All the Machine Or Equipment Of the Plant.
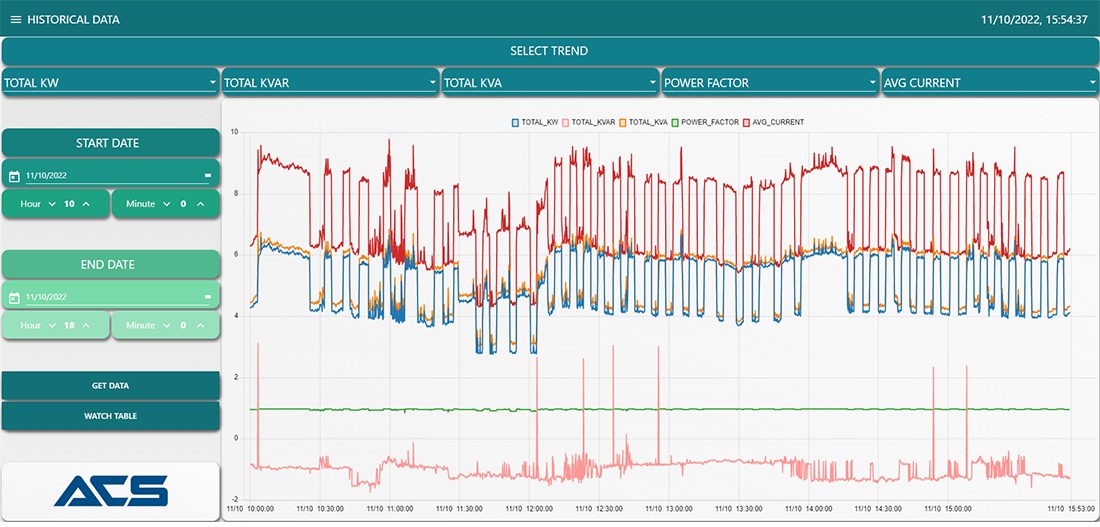
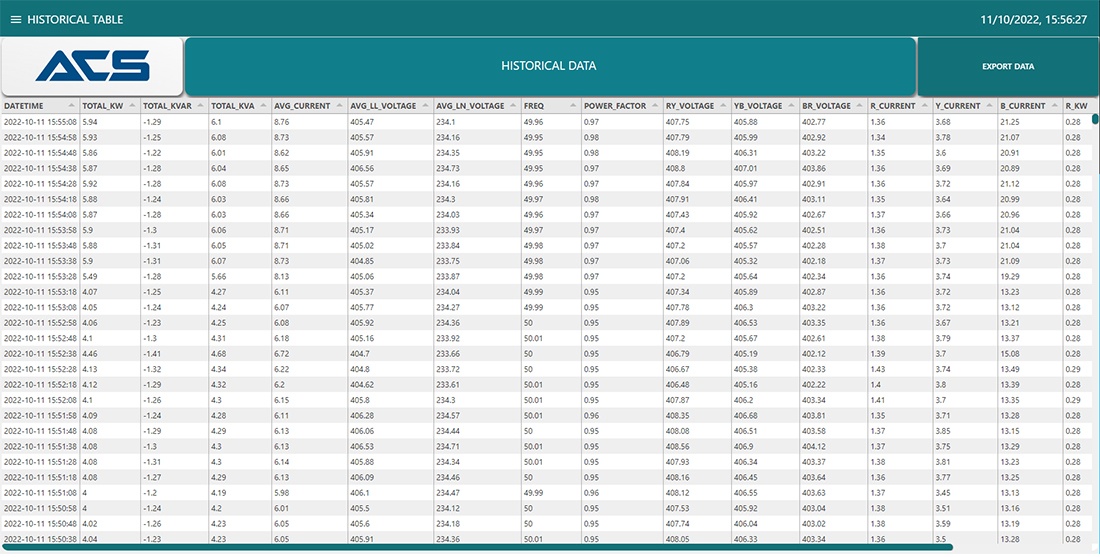
- Historical Data is the main feature of any System or Plant for analysis and other Key factors.
- Different Types Of filters available for the Historical Trends and Historical Data.
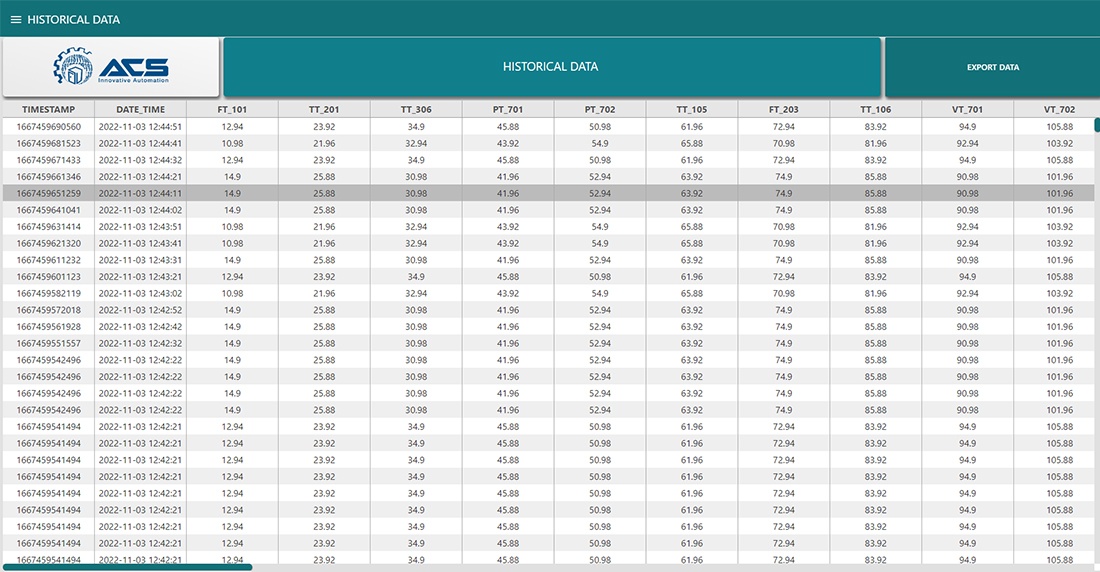
- Easy to Export All the Filtered Data in CSV File at Desired Destination.