
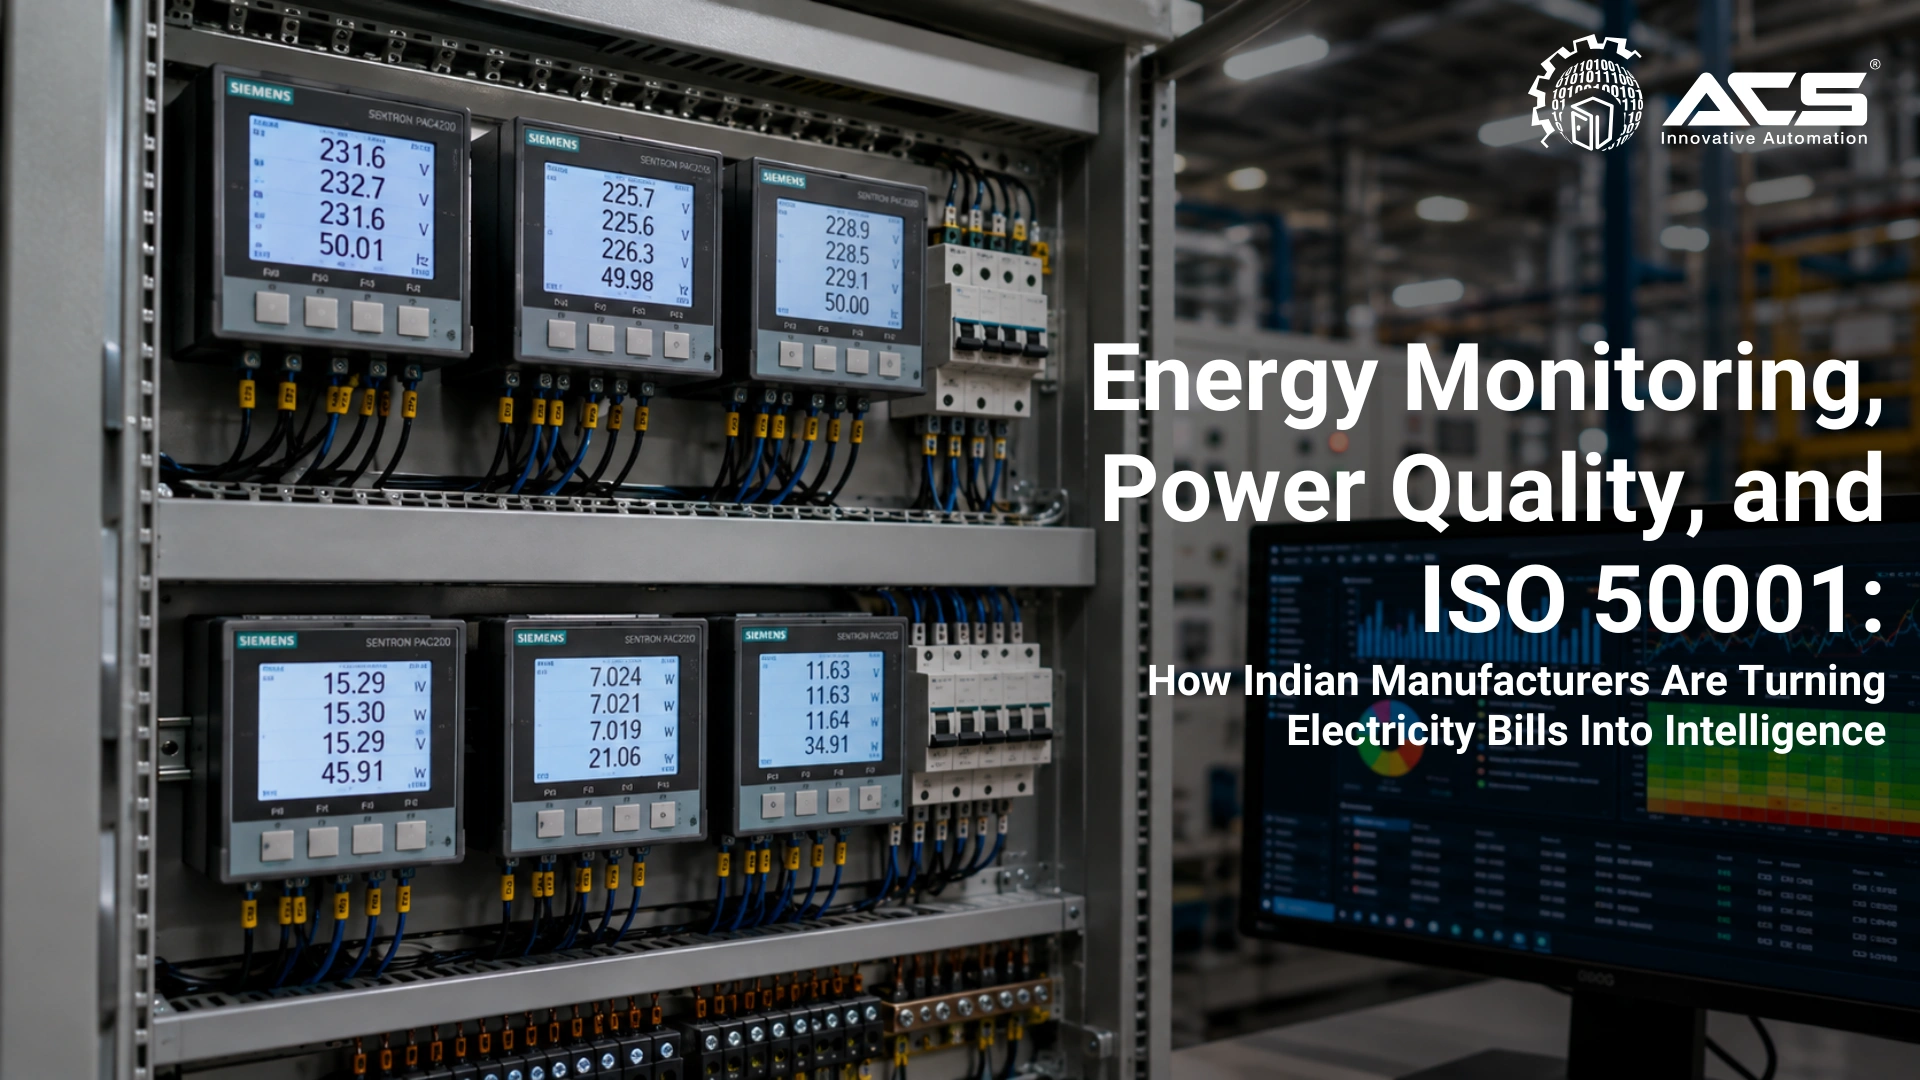
Energy Monitoring, Power Quality, and ISO 50001: How Indian Manufacturers Are Turning Electricity Bills Into Intelligence
When it comes to electrical energy monitoring, the Energy Monitoring Gap in Indian Industry
Many manufacturing plants still rely primarily on the monthly electricity bill from their DISCOM. The information arrives after the billing period and may provide little or no breakdown by equipment, process area, shift, or operating condition.
Decisions about energy cost, equipment investment, shift scheduling, production planning, are made on this single data point. It is equivalent to running a financial operation with only a bank statement and no transaction history.
Energy monitoring transforms this: from one number per month to real-time, equipment level, timestamped power consumption data , available on a SCADA dashboard and in automated reports.
What Energy Monitoring Actually Measures
Active Power (kW) and Energy (kWh)
Active power, measured in kilowatts, is the real power consumed by equipment and converted into useful work (mechanical energy, heat, light). Energy (kWh) is the integral of power over time. Active energy is a common billing quantity, although some tariffs also use apparent energy, demand, power factor, and time of day components.
Reactive Power (kVAR) and Power Factor
Reactive power exchanges energy with inductive or capacitive loads without producing net useful work. It increases current for a given kW and may affect billing through power factor, kVAh, or reactive energy provisions, depending on the tariff.
Power Factor (PF) is the ratio of active power to apparent power:
Power Factor = kW / kVA = cos φ
A power factor of 0.75 means real power is 75% of apparent power. The associated reactive component increases current for the same useful kW, raising losses and reducing available electrical capacity.
Many Indian tariffs apply power factor incentives or penalties, but thresholds and billing methods must be checked against the consumer's current tariff order.
Harmonics and Total Harmonic Distortion (THD)
Nonlinear loads, VFDs, switching power supplies, UPS systems, and LED lighting, draw non-sinusoidal current from the supply. This introduces harmonic frequencies (3rd, 5th, 7th harmonics at 150 Hz, 250 Hz, 350 Hz on a 50 Hz supply) into the electrical network.
Effects of high THD:
- Overheating of transformers and neutral conductors (neutral current can exceed phase current in high harmonic environments)
- Nuisance tripping of protection relays
- Interference with sensitive instrumentation and PLC power supplies
- Capacitor bank failure in power factor correction systems
Harmonic assessment should distinguish equipment emission limits from system level power quality limits. Applicable requirements depend on equipment current, supply voltage, point of common coupling, utility rules, and standards such as the relevant IEC 61000 series or IEEE 519.
The Siemens SENTRON PAC Series: Power Monitoring at the Panel Level
| Product | Specifications and Application |
|---|---|
| SENTRON PAC3200 / PAC3220 | Power monitoring for feeders and submain distribution, with electrical measurements and communication options depending on the selected model and expansion module |
| SENTRON PAC4200 | Higher performance power monitoring with harmonics, event functions, and expandable communications for incomers and detailed energy transparency |
Advanced SENTRON measuring devices
Select accuracy class, power quality functions, and communications according to the metering objective and approved measurement plan
DIN rail and branch circuit metering
Compact devices can support circuit level submetering where installation, CT selection, accuracy, and communications are correctly engineered
Selected SENTRON PAC devices and communication modules can integrate with Siemens PLC and WinCC architectures through supported protocols such as Modbus TCP, Modbus RTU, PROFIBUS, or PROFINET, depending on the model and system design.
ISO 50001: Energy Management Systems Standard
ISO 50001:2018 is the international standard for Energy Management Systems (EnMS). It provides a framework for organizations to systematically manage energy use, reduce consumption, and demonstrate continuous improvement. It follows the same PlanDoCheckAct (PDCA) structure as ISO 9001 (quality) and ISO 14001 (environment).
Key ISO 50001 Concepts
| Concept | Definition and Requirement |
|---|---|
| SEU (Significant Energy User) | Energy uses that account for substantial energy consumption or offer considerable potential for energy performance improvement; identified through the organization’s energy review |
| Energy Baseline | A quantitative reference used to compare energy performance. The baseline period and data quality must be appropriate to the organization’s activities and normalization variables |
| EnPI (Energy Performance Indicator) | A quantified metric for energy performance: e.g., kWh per tonne of product, kWh per cubic meter of water treated, kWh per operating hour |
| Energy Objectives and Targets | Specific, measurable improvement goals: e.g., 'Reduce chiller specific energy from 0.75 kWh/RT to 0.65 kWh/RT within 12 months' |
| Internal Audit | Periodic internal review of EnMS implementation, required for ISO 50001 certification maintenance |
Building an ISO 50001Compliant Energy Monitoring Infrastructure
1. Energy metering at SEU level: Install SENTRON PAC meters at the incomer of every significant energy consumer, compressors, chillers, furnaces, pumping stations. Sub circuit metering within MCCs for individual major motors.
2. SCADA energy dashboard: Integrate all PAC meters into the SCADA historian. Build an energy dashboard showing real-time kW by area, daily and monthly kWh trend, and PF trend per section.
3. EnPI calculation in SCADA: Configure calculated tags in WinCC: kWh per unit of production, normalized against production throughput. These are the metrics that reveal true energy efficiency independent of production volume.
4. Automated energy reporting: Daily, weekly, and monthly energy reports autogenerated from historian data, eliminating manual data collection and enabling consistent measurement.
5. Demand management alerts: Configure alarms for maximum demand (kVA) approaching contracted demand limit, enabling operators to defer noncritical loads and avoid demand charge penalties from the DISCOM.
Maximum Demand Management: The Hidden Billing Lever
Many industrial tariffs include billing demand or maximum demand charges based on a specified demand interval and tariff formula. The interval, ratchet provisions, minimum billing demand, and charge rate vary by utility and consumer category.
With real-time demand monitoring in SCADA, plants can:
- Track instantaneous demand versus the contracted maximum
- Configure staged demand warnings at project defined thresholds so operators or automated load management logic can defer approved noncritical loads before a billing peak is established
- Reduce the contracted demand threshold at the next tariff revision, directly reducing fixed charges
Illustrative principle: when billing demand is consistently lower than contracted demand, the plant may evaluate load scheduling, peak control, and an appropriate contract demand revision, subject to the applicable supply code and utility approval.
The financial saving must be calculated using the consumer's current tariff order, billing demand formula, penalties, taxes, and contract conditions.
Conclusion: Energy Data Is Manufacturing Competitive Advantage
In an environment of rising electricity costs, shrinking margins, and increasing ESG scrutiny from customers and investors, energy intelligence is becoming a manufacturing competitive differentiator. The plants that know exactly where their energy goes, by equipment, by shift, by product type, are the ones that can systematically reduce it, report on it, and prove their efficiency credentials.
The business case should be calculated from the site's metering gaps, tariff structure, energy saving opportunities, reporting needs, and implementation cost. Payback varies substantially by plant.
Suggested social hashtags: #EnergyMonitoring #ISO50001 #PowerQuality #SENTRON #SiemensPAC #WinCC #MaximumDemand #EnMS #ACSEngitech #IndustrialEnergy
About ACS Engitech Pvt. Ltd.
Since 2009, ACS Engitech has delivered automation solutions across manufacturing sectors. As a Siemens Channel Partner, we provide comprehensive automation systems including PLC panels, SCADA implementation, and remote monitoring solutions. Our 6000 sq. ft. manufacturing facility in Ahmedabad serves clients across India with ISO 9001-certified control panel solutions.
Take Action Today
Ready to optimize your facility? Connect with us to discuss how automation can improve your operations and address critical demands.
Connect With Us